A repeat of 2023? Smaller-capitalization stocks led the charge earlier in the year, only to fall behind large-capitalization stocks as the year progressed. Stop me if you’ve heard this before, but the largest market capitalization companies are carrying market returns, again. Not only has it been déjà vu for stocks, but also economic growth remains steadfast in the face of higher interest rates and inflation is still above the Federal Reserve’s comfort level. However, under the surface, there are many interesting observations of the economy and markets that differ from last year.
ECONOMY REMAINS BALANCED
Given the U.S.’ overwhelming dependence on consumption, tracking spending can help explain the trajectory of economic activity. Consumption continues to be a bright spot on the insistence to spend post-2020. The U.S. Personal Consumption Expenditures Index, which tracks U.S. consumer spending, is advancing at a 2.4% rate, which is above the average rate of 2.3% from 2010-2020. This indicator is likely influenced by services, as goods spending has cooled off moderately.
Employment Growth Trending Higher
3-month average for payrolls on the rise from late October: positive sign for
corporate earnings outlook
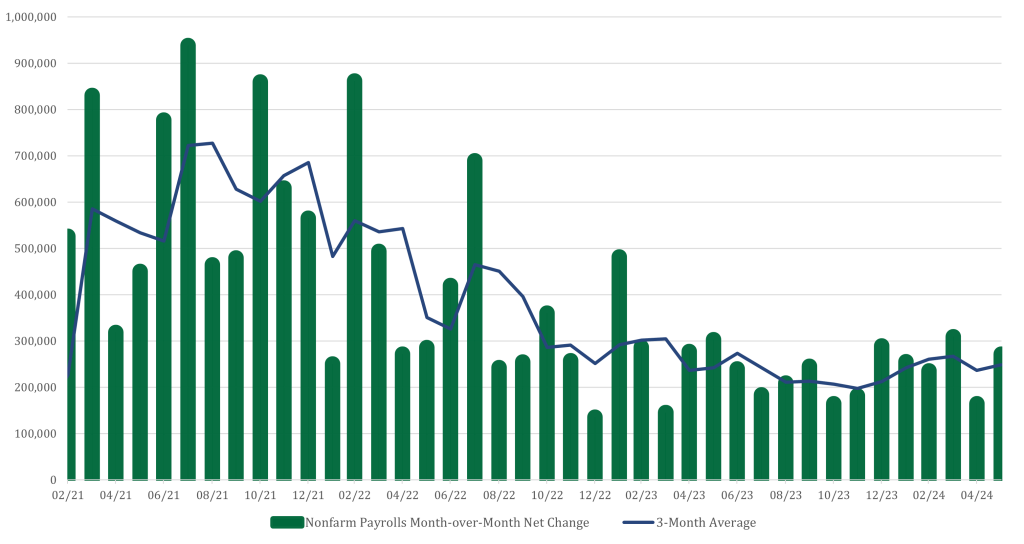
Nonfarm payrolls, a preferred gauge of tracking jobs in the U.S. economy, continues to rise against the headwind of higher interest rates. Jobs added in May surpassed 200,000, continuing an upward trend set in November 2023. The three-month moving average of job gains has increased by 50,000 jobs since late last year, emphasizing a solid labor market. While the nonfarm payrolls economic indicator receives the most attention, another gauge of employment accounts for a wider scope of the labor market. The household survey produces information on the unemployment rate and includes self-employed workers, making it a better representation of the jobs outlook. This survey has started to cool lately, with the unemployment rate rising to 4% in May, from a cyclical low of 3.4% earlier in 2023. Essentially, the labor market has not been able to shoulder new labor entrants. Overall, the labor market remains in good shape, but a higher unemployment rate is worth a follow given its historical importance of influencing the Federal Reserve’s target policy.
FEDERAL RESERVE SEES INFLATION PROGRESS
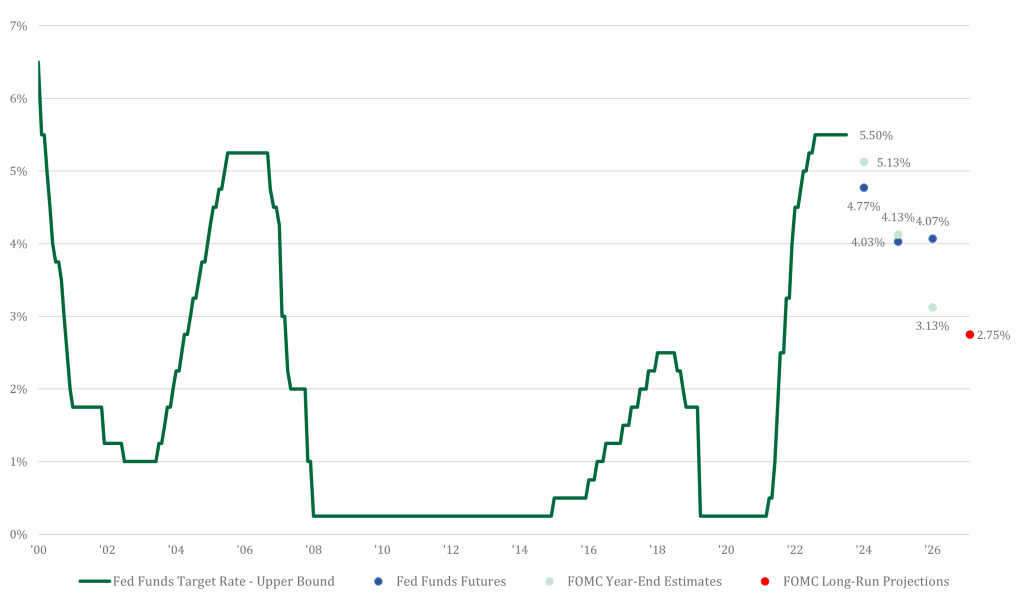
Since increasing the upper bound of the Federal Reserve (Fed) target rate in July of 2023 to a level of 5.50%, the Fed went on pause to assess the trajectory of inflation and economic activity. Instead, it has used commentary to adjust expectations, trying to balance the current level of economic activity and bringing inflation lower. Fed chair Jay Powell noted through June’s Federal Open Market Committee statement that there has been “modest further progress toward the Committee’s 2 percent inflation objective,” a change from a month earlier noting that “there has been a lack of further progress.” As a result at the end of June, the market priced in a more than 50% chance of a rate cut in September 2024 and second in December 2024.
Fed Funds Rate Expectation: Market & FOMC
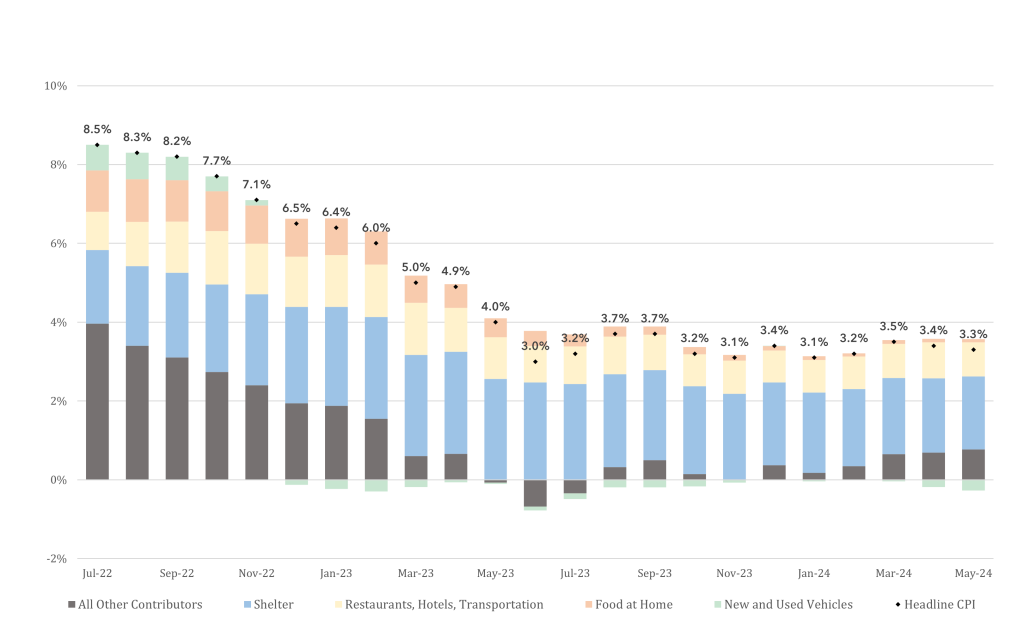
SHELTER PRICES TRACKING LOWER
The market’s outlook of inflation returning to a level closer to 2% is maintained. Estimates of inflation expectations ended the 2nd quarter at 2.27%. While price growth has returned closer to normal after years of exponential increases, services is keeping the year-over-year Consumer Price Index (CPI) in a range of 3% to 4% since June 2023. Restaurant, Hotel, and Transportation costs are slowing, but shelter costs are contributing the most to inflation. The market’s belief in shelter costs returning to normal is largely a result of real-time shelter indexes. There are two indicators of real-time price growth: Zillow Rent Index and the Cleveland Fed New Tenant Repeat Index. The Zillow Rent Index is growing at a 3.4% level, while the Cleveland Fed New Tenant Repeat Index is increasing at a 0.4% level. Taking an average of both, rent price growth is below the Fed’s preferred level of 2% and below the current CPI estimate of shelter price growth of 5.7% (CPI shelter price accounts for new and old prices).
Contributors to Headline CPI Inflation
Inflation growth decline stalling
MEGA STOCKS LEAD
Large-capitalization growth stocks remain in fashion, but the bar is getting higher and harder to exceed. The S&P 500 Growth index, which represents the highest earnings growers, has advanced 23.6% this year, while the S&P 500 Value index, which represents stocks with low valuations, is only up 5.8%. The performance dispersion is wide, but there’s good reason for the disparity. The emergence of Artificial Intelligence (AI) is the main catalyst, separating the highest growers and everyone else. Using the Magnificent 7 moniker as a representation of companies benefiting from AI, the Magnificent 7 segment is growing at a level of nearly 30% in 2024. That is up from 22% to begin the year. Not only is this segment growing faster than the market, but growth is exceeding initial expectations. As mentioned earlier, the valuation premium on this growth segment continues to get more unsettling. In fact, the valuation of large-cap growth stocks relative to large-cap value stocks is at its highest level in the last 20 years. Remember, where you start is more important than where you finish.
BONDS FOLLOW RISK SENTIMENT
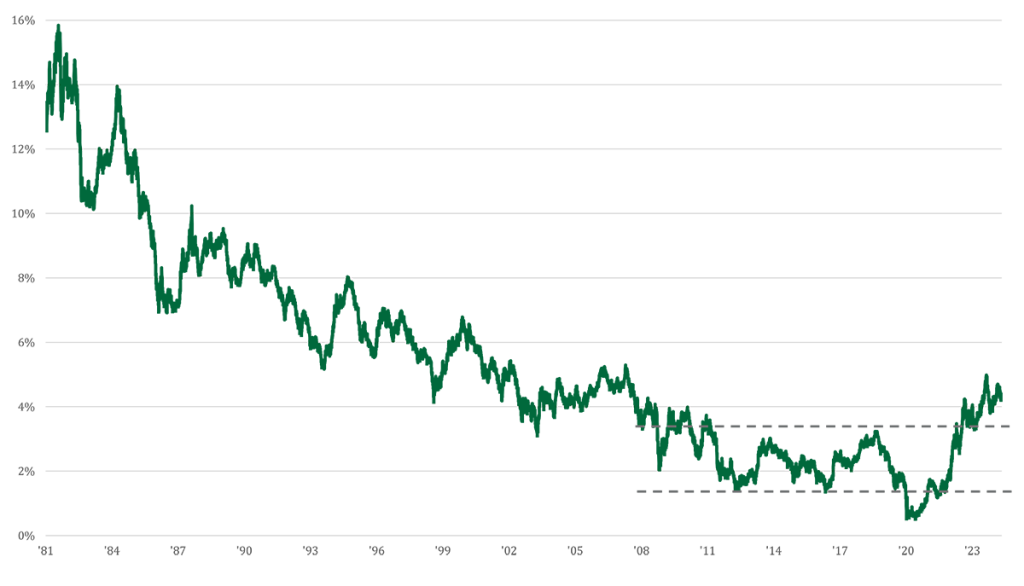
Following the lead of stocks, the performance of bonds has tracked overall market sentiment of risk preference this year. So far in 2024, the Bloomberg High Yield index has returned 2.6%, while the Bloomberg Aggregate Index has dropped -0.7%, and the Bloomberg Investment Grade Corporate index is down -0.5%. Bonds with the most risk outperformed bonds with less credit risk and more interest rate risk. Investment grade bonds typically have a longer duration, so when interest rates rise, prices are negatively impacted relative to High Yield bonds. The 10-year Treasury yield ended 2023 at 3.88%, increasing to a high of 4.7% and finishing at a level of 4.4% on June 30.
10-year Treasury Yield Above the 2008-2019 Range
SMALL-CAPS LEFT BEHIND
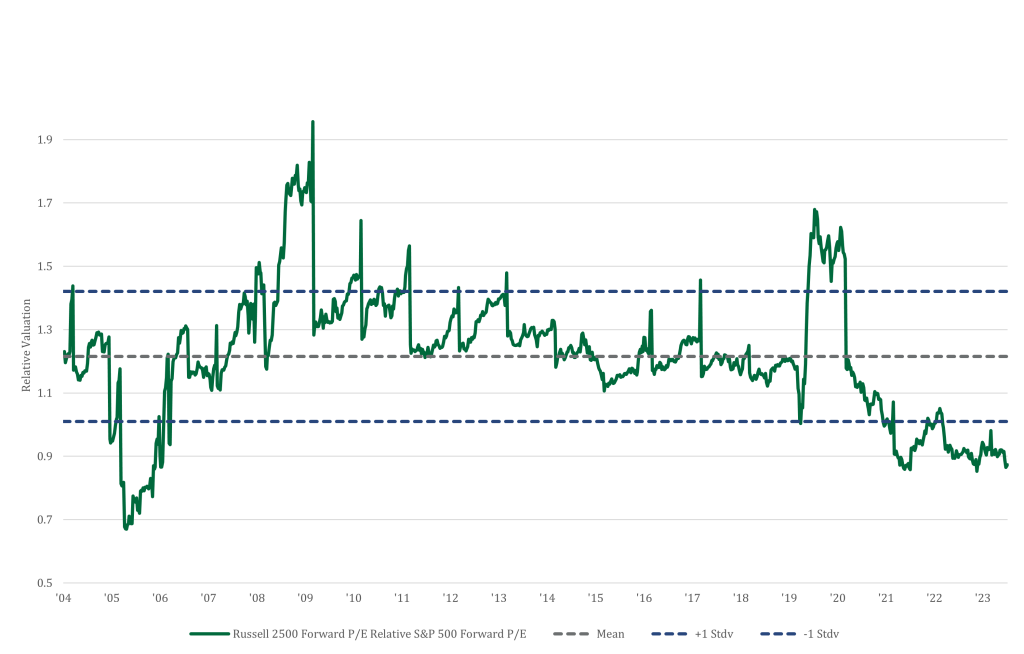
Solid economic activity and positive risk sentiment has not been enough of a catalyst for small-cap stocks. However, there are reasons to believe the market environment is conducive for smaller companies. To start, a downshift in interest rates will predominantly support this segment. Smaller companies tend to rely on banks for funding, as opposed to capital markets. Bank funding resets more often to the market, so any shift lower in interest rates should go straight to the bottom line. Also, if we enter a cyclical regime of lower rates, this should push the yield curve into a positive territory, as short-term rates fall faster than long-term rates. As the small-cap index favors more cyclical companies, especially banks, a positive yield curve is a potential boon for expected profitability moving forward. An improving profitability outlook coupled with a historically wide valuation relative to larger companies gives investors greater room for error. The Russell 2500 index, which incorporates the small and medium sized companies, is trading at the widest discount in 17 years. Any relative profitability benefit for small and medium sized companies will outweigh that of larger companies, creating an outsized opportunity for lower market capitalization companies.
Russell 2500 Index P/E Relative to S&P 500 Index P/E
Valuations on small & medium sized U.S. companies are now also trading at a historical discount relative to large U.S. companies
Although we believe it to be reliable as of the publication date and have sought to take reasonable care in its preparation, all information provided is FOR INFORMATIONAL PURPOSES ONLY and we make no representations or warranties regarding its accuracy, reliability, or completeness and assume no duty to make any updates in the event of future changes. Past performance may not be indicative of future market results. Any examples used (including specific securities) are generic and meant for illustration purposes only and are not, and should not be interpreted as, offers to buy or sell such securities. To the extent indices are referenced, please note that you are not able to invest directly in an index.
Nicolet Wealth Management is a brand name that refers to Nicolet National Bank and certain of its departments and affiliates that provide investment advisory, trust, retirement planning and insurance services. Investment advisory services offered through Nicolet Advisory Services, LLC (dba Nicolet Wealth Management), a registered investment advisor. Securities offered through Private Client Services, LLC (“PCS”), member FINRA/SIPC. PCS is not affiliated with Nicolet National Bank or Nicolet Wealth Management.
All investments are subject to risks, including possible loss of principal, and are: NOT FDIC INSURED; NOT INSURED BY ANY FEDERAL GOVERNMENT AGENCY; AND NEITHER DEPOSITS OR OTHER OBLIGATIONS OF, NOR GUARANTEED BY, Nicolet National Bank or any of its affiliates. Neither Nicolet Advisory Services nor its affiliates offer tax or legal advice. You should consult with your legal and tax professionals before making investment decisions.

Listen & Subscribe to our Podcast
Tune in for the next episode, subscribe or follow us wherever you listen to podcasts.