Rates Climb Higher
Bonds with Longest Maturities Underperform
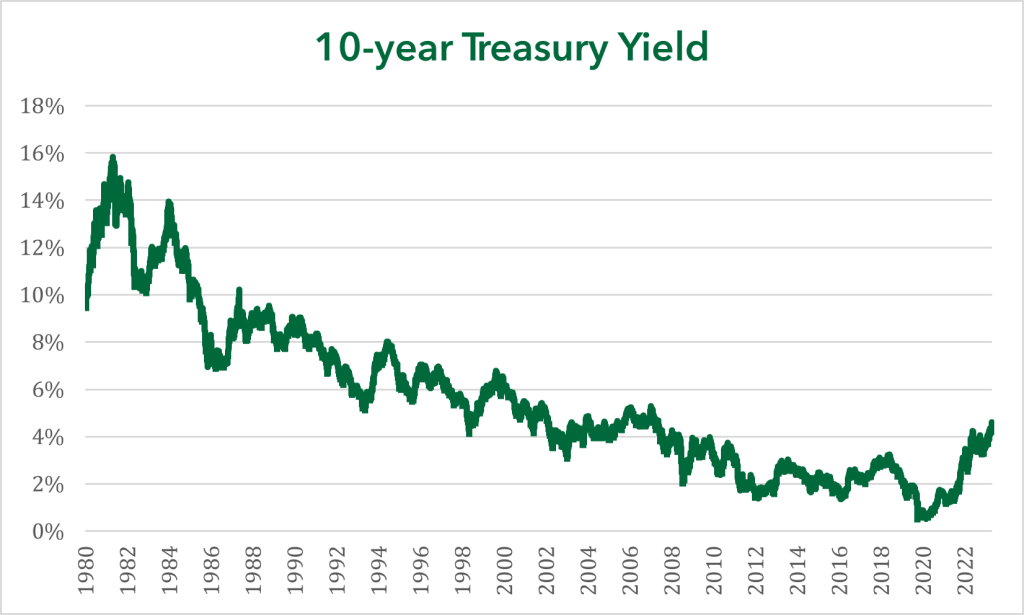
Treasury bonds with maturities 3-years and longer exhibited the most significant interest rate increase, with the 10-year Treasury yield rising 0.46% and the 30-year Treasury yield increasing 0.49%. In contrast, rates inside of 1-year were up less than 0.06%. An interruption of the downward inflation rate trajectory (August consumer prices increased 3.66% year-over-year from 2.96% in June) shifted expectations on the level of rates moving forward. As a result, bond asset classes with longer maturities exhibited a greater price decline. Municipal and investment grade corporate bond indexes had similar price declines, falling more than -2.5%, while the high yield bond index decreased only -1.2% because of its lower relative maturity. Interest rate risk was the most significant determinant of performance, but high yield’s relative rate to Treasury bonds increased too, reflecting a degree of risk aversion, following weakness in the stock market.

U.S. Equity Markets Balance Risks
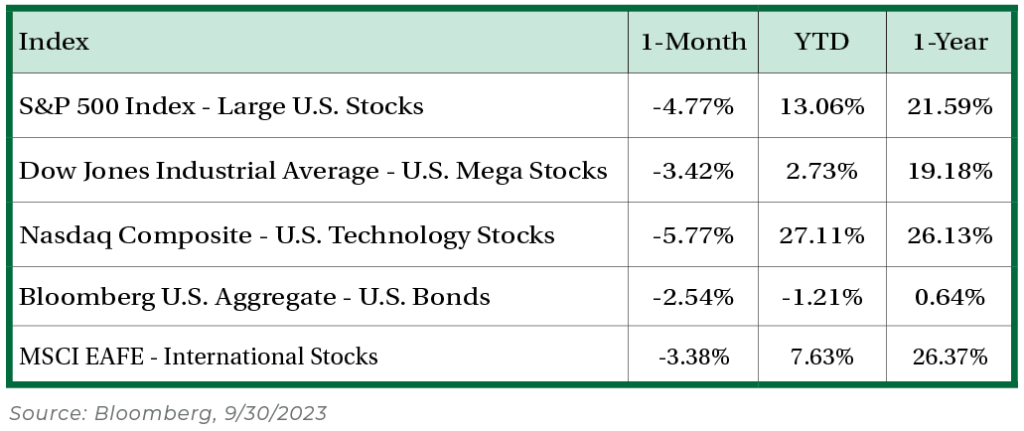
U.S. large-capitalization equities had another difficult month, declining about -4.8% and more than doubling August’s negative performance. Investors are weighing a few important factors: global growth uncertainty, rising interest rates, slowing improvement of earnings, and concentrated market returns. Rising interest rates has had the greatest impact on stocks, considering the performance distribution of large-capitalization sectors. The most interest-rate sensitive sectors (real estate and utilities) underperformed the most. Each of these sectors have above-market dividend yields that compete with interest rates of bonds. As interest rates rise, investors prefer the safer returns of bonds rather than the dividend yields of riskier equities.
Energy Stocks Withstand Market Unease
Every equity sector in the large-cap universe saw prices decline in September, except Energy. A few reasons can explain the sector’s relative outperformance, with oil’s price rally topping the list. Oil traded at the New York Mercantile Exchange increased above $90 a barrel during the month, the highest level since the end of 2022. In fact, oil has increased in price by more than $20 a barrel since the end of June 2023. The move can be explained by first, Saudi Arabia and Russia extending production cuts through December 2023. Second, global oil demand rose to a record high in August. The combination of these two factors has created a significant deficit in oil supplies.
IPO Activity in September
Last month, three companies (Instacart, ARM Holdings, and Klaviyo) offered shares to the public in a new equity issuance, also known as an initial public offerings (IPO). IPO activity signals confidence in capital markets. For example, more than 400 initial public offerings were completed in 2020 & 2021. Since the beginning of 2022, there have been only 32 total completed IPOs. While newly issued equity shares typically performed poorly over the subsequent 12 months, IPO activity coincides with strong overall equity market performance. The broad large-cap equity market is currently about 10% below its all-time peak set in early 2022. Healthy capital markets are necessary for sustained bull markets.
Consumption Headwinds?
Student loan payments resume in October as balances will be charged interest after being in forbearance the last three years. The impact on consumer spending is notable, but unlikely to be a severe headwind. The worst-case scenario, a full resumption of student loan payments in October could equate to about $70 billion at an annual rate or 0.3% of real disposable personal income, according to data from Goldman Sachs. The resumption of student loan payments is unlikely to outweigh strong gains of real income growth over the past year.

Nicolet Wealth Management
Although we believe it to be reliable as of the publication date and have sought to take reasonable care in its preparation, all information provided is FOR INFORMATIONAL PURPOSES ONLY and we make no representations or warranties regarding its accuracy, reliability, or completeness and assume no duty to make any updates in the event of future changes. Past performance may not be indicative of future market results. Any examples used (including specific securities) are generic and meant for illustration purposes only and are not, and should not be interpreted as, offers to buy or sell such securities. To the extent indices are referenced, please note that you are not able to invest directly in an index.
Nicolet Wealth Management is a brand name that refers to Nicolet National Bank and certain of its departments and affiliates that provide investment advisory, trust, retirement planning and insurance services. Investment advisory services offered through Nicolet Advisory Services, LLC (dba Nicolet Wealth Management), a registered investment advisor.
All investments are subject to risks, including possible loss of principal, and are: NOT FDIC INSURED; NOT INSURED BY ANY FEDERAL GOVERNMENT AGENCY; AND NEITHER DEPOSITS OR OTHER OBLIGATIONS OF, NOR GUARANTEED BY, Nicolet National Bank or any of its affiliates. Neither Nicolet Advisory Services nor its affiliates offer tax or legal advice. You should consult with your legal and tax professionals before making investment decisions.


